EO Dashboards
Interactive Web GIS and dashboard tools translating Earth observation, soil, and irrigation indicators into decision-support interfaces.
EO Dashboards
Interactive UI & Decision-Support Design
EO Dashboards bring soil, climate, and field-scale indicators into interactive interfaces that make technical outputs easier to inspect, communicate, and use in applied decisions.
EO Dashboards bring soil, climate, and field-scale indicators into interactive interfaces that make technical outputs easier to inspect, communicate, and use in applied decisions.
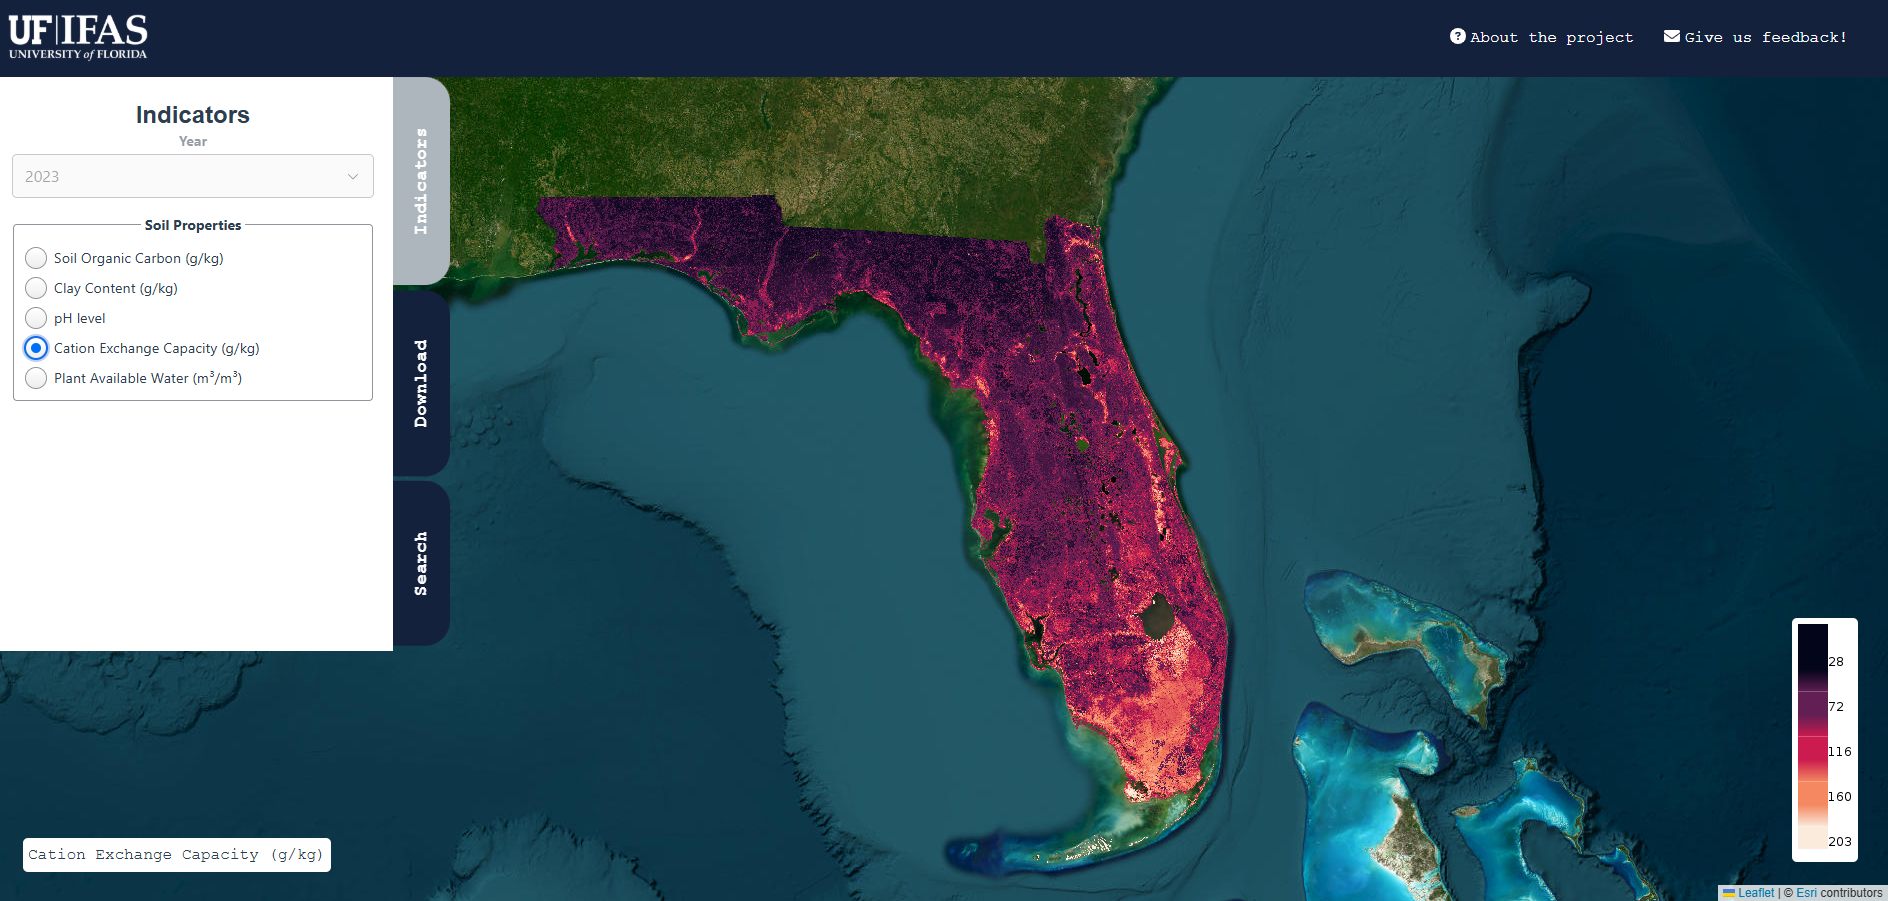
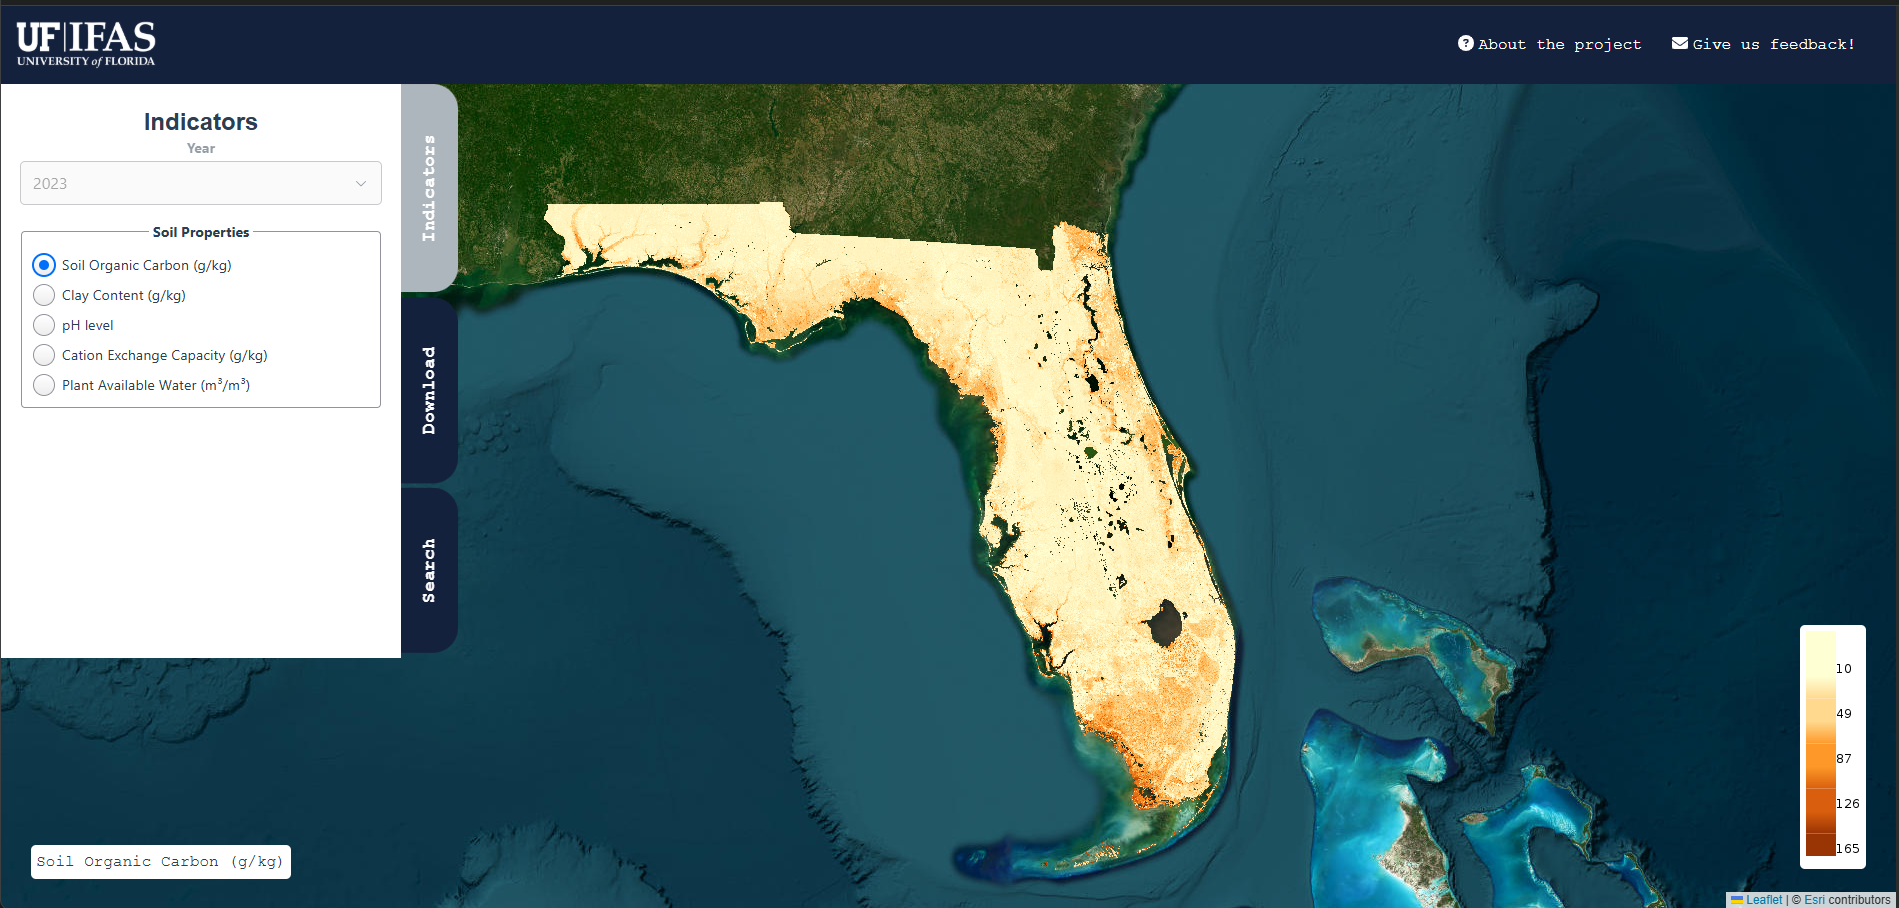
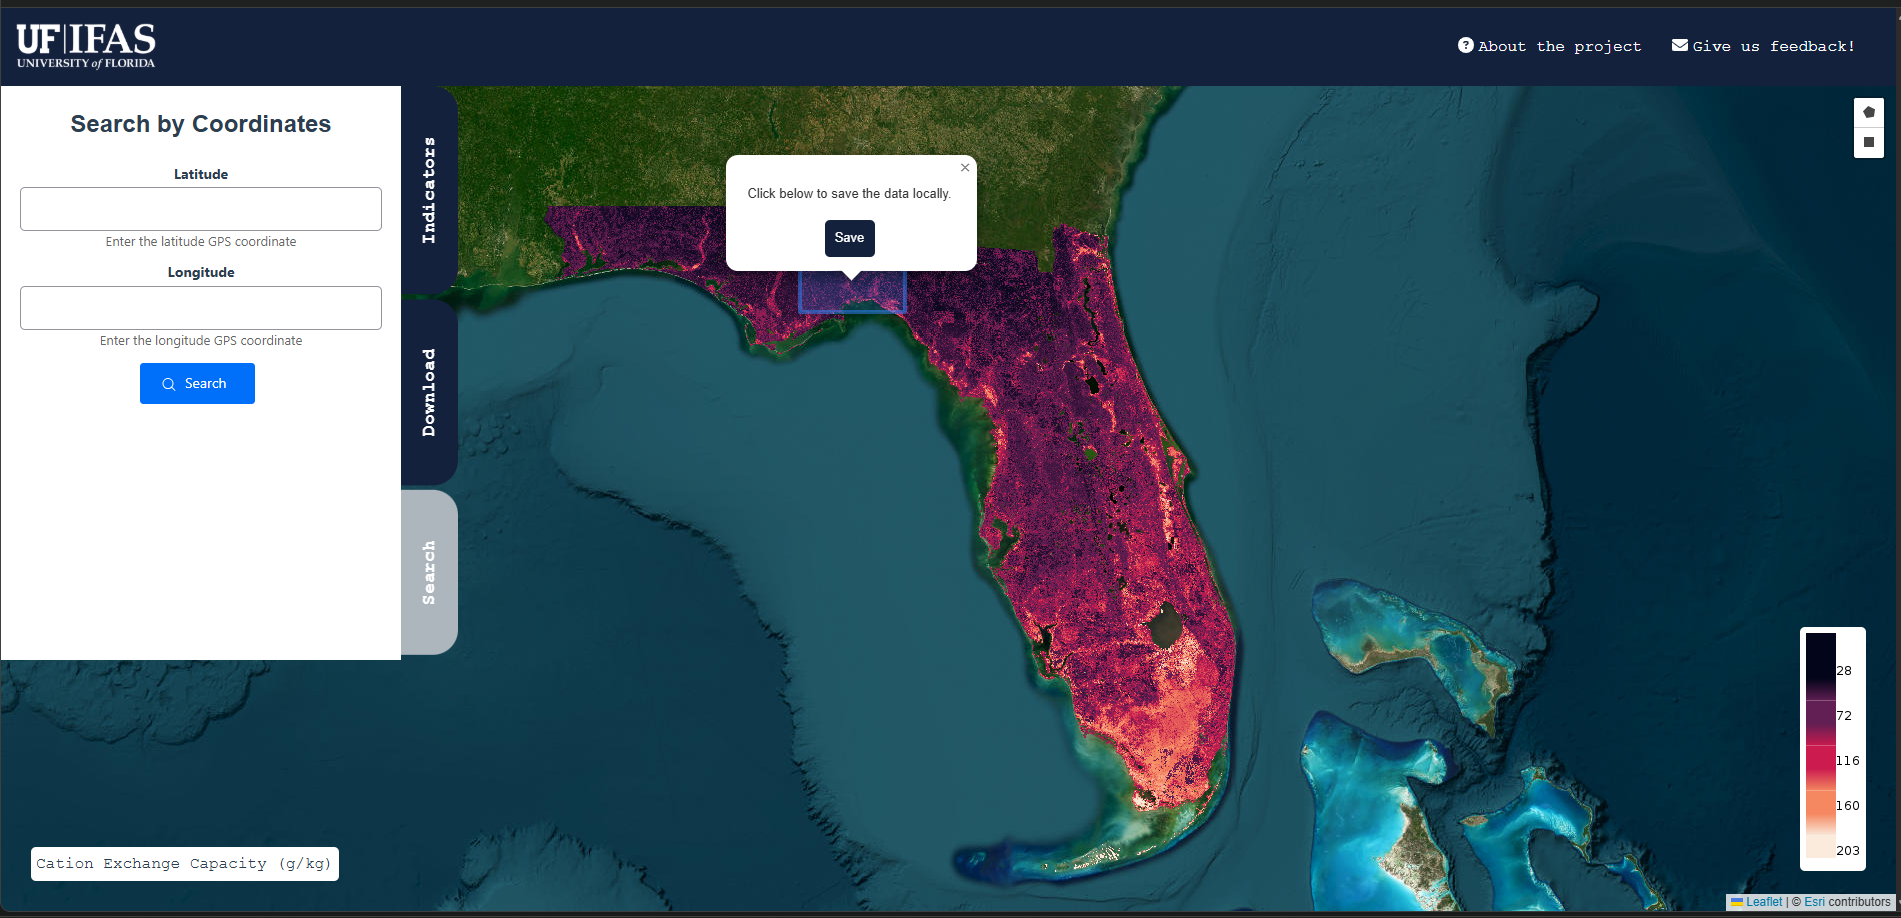
An interactive Web GIS environment for exploring EO-derived soil indicators, querying locations, comparing areas of interest, and supporting interpretation of spatial variability.
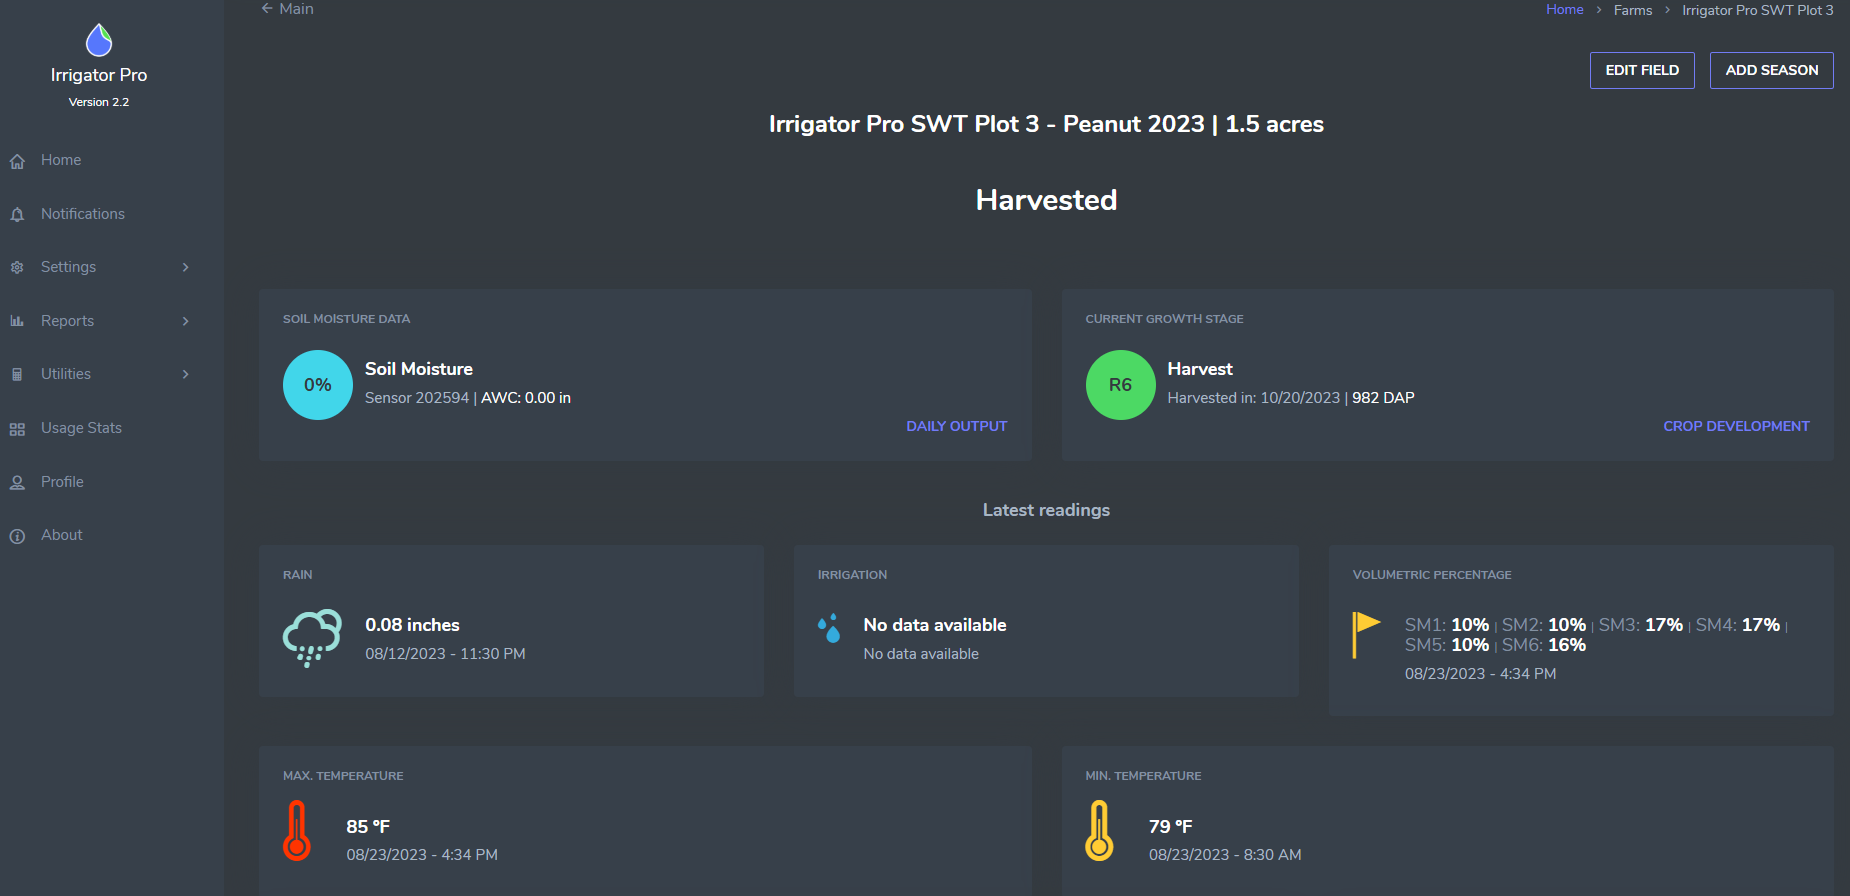
An irrigation scheduling interface integrating soil moisture sensors, weather data, and crop/field context to support practical irrigation decisions.
Designed for usability, fast interpretation, and stakeholder communication, with clear layer controls, map interaction, and export-ready outputs where applicable.
Key Features
- Interactive maps for EO-derived soil/land indicators
- Farm/field exploration with layer controls
- Time-series context for monitoring change
- Built for communication and decision support